

The Whatoblock live cyber attack map shows the attacks our honeypot sensors recorded in the last 24 hours, together with the proxies and Tor exit nodes tracked by Whatoblock Heartbeat. Every attack is drawn on a globe from where it came from to where it was aimed, and the map updates every 10 minutes. This article explains how to read it and looks at one full day of it in numbers: 6 November 2026, UTC.

What the live cyber attack map shows
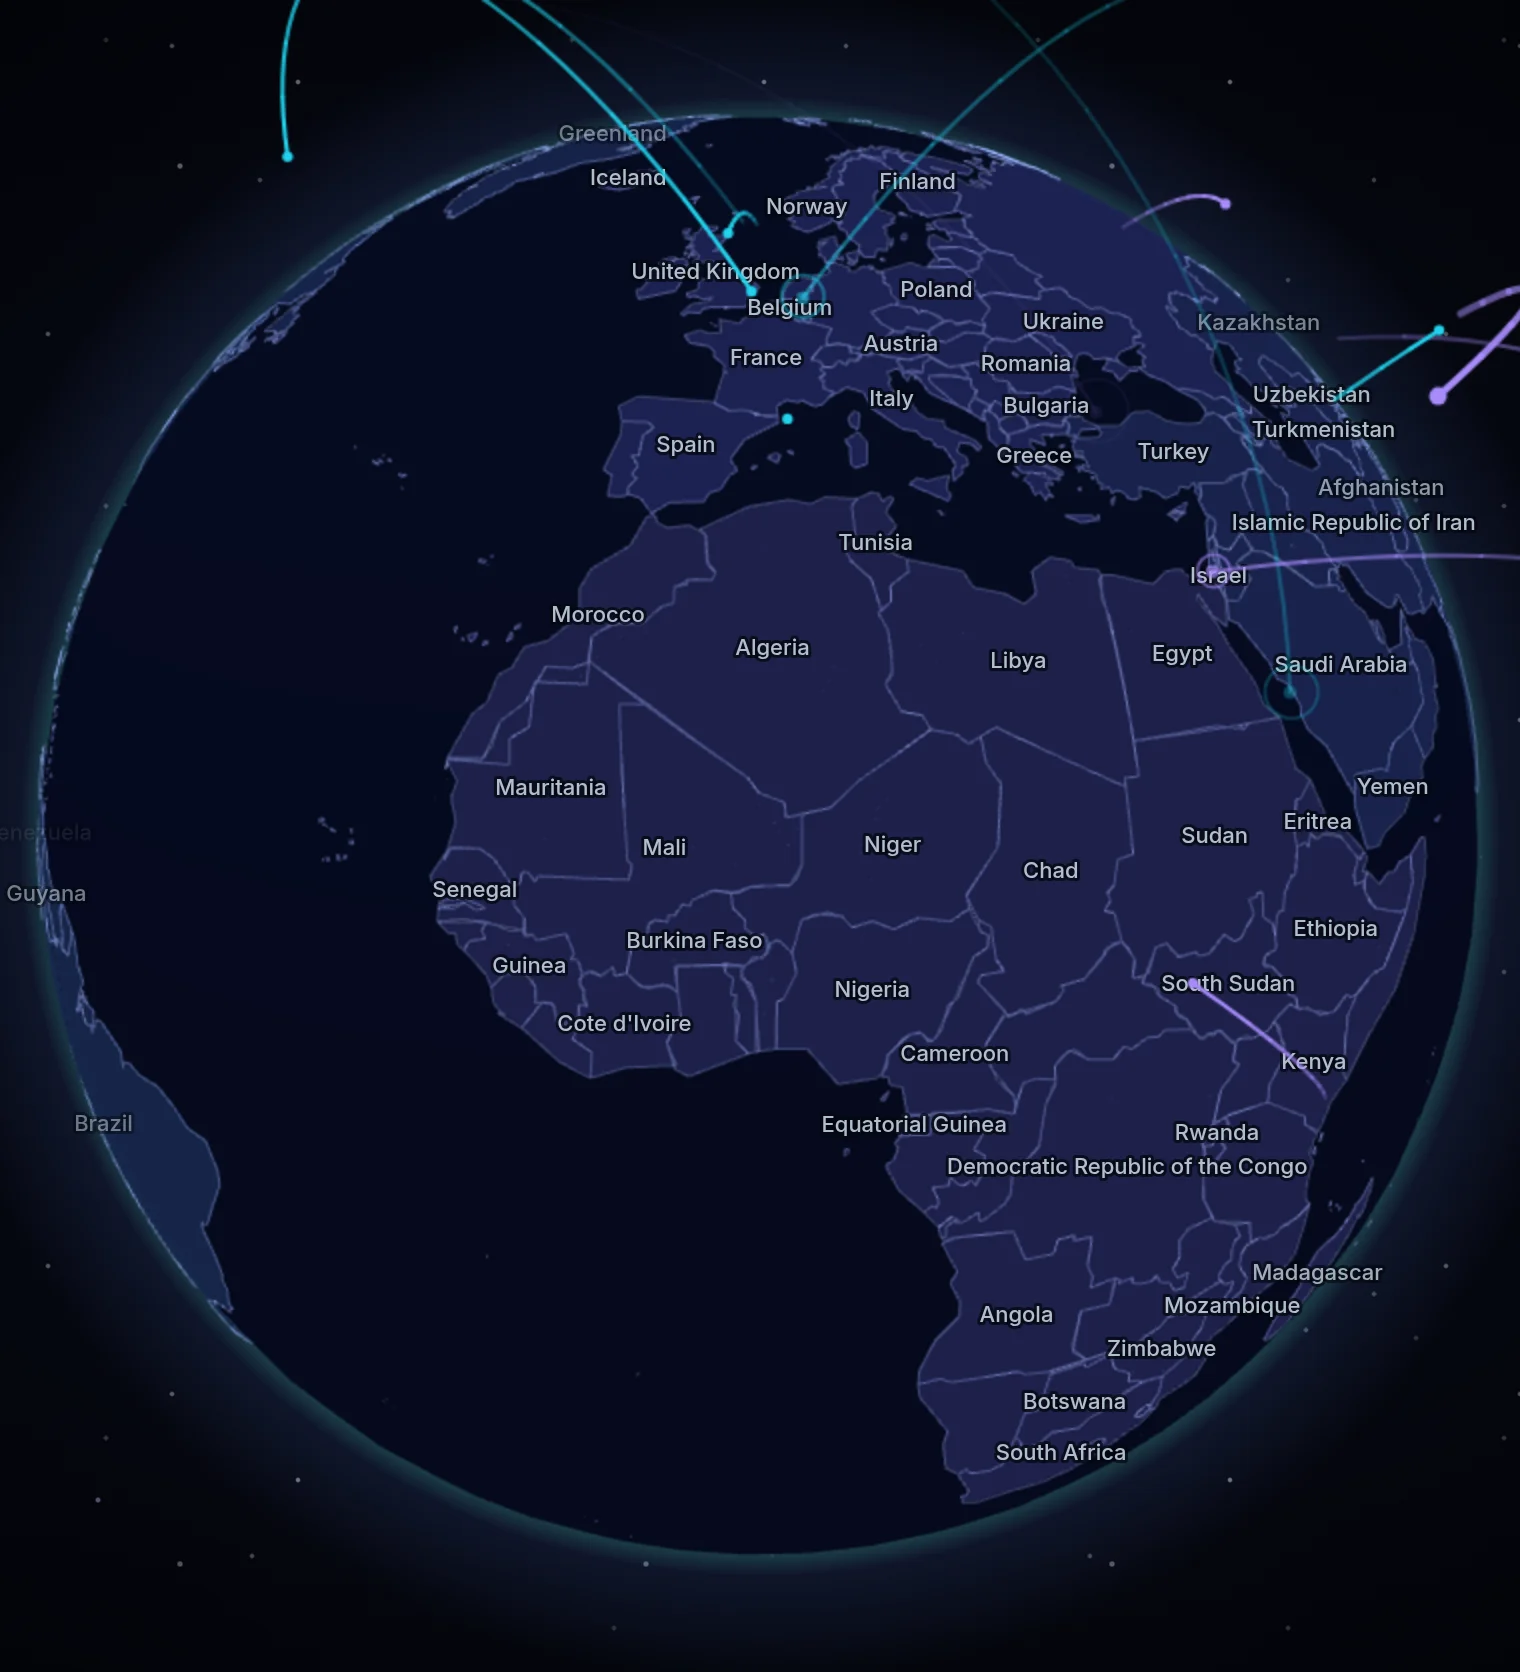
The 3D view of the live cyber attack map.
The map has three layers, each with its own colour:
- Botnet, cyan arcs. An infected device attacking a new target, usually trying to make it download malware from a server the botnet uses.
- Scanner, violet arcs. An address probing for open ports, weak logins and exposed services.
- Heartbeat, orange pulses. Proxies, Tor exit nodes and other infrastructure tracked by Whatoblock Heartbeat, shown at the place they were seen.
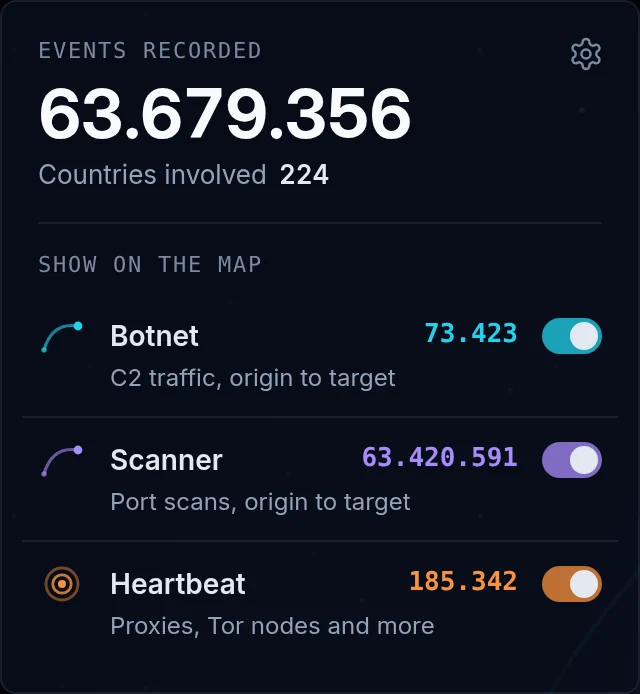
The legend counts the last 24 hours, so its numbers move as the day rolls on.
How to read it
- Switch layers on and off. The switches under Show on the map hide a layer, and the counts beside them show how many events each layer holds.
- Watch Live activity. The list beside the globe names each event as its arc appears, with the origin and a shortened address.
- Use Top countries. It ranks the countries the attacks came from by their share of all events. Click a country to turn the globe to it.
- Choose 2D or 3D. The flat map shows the whole world at once, the globe is easier to follow on a single region.
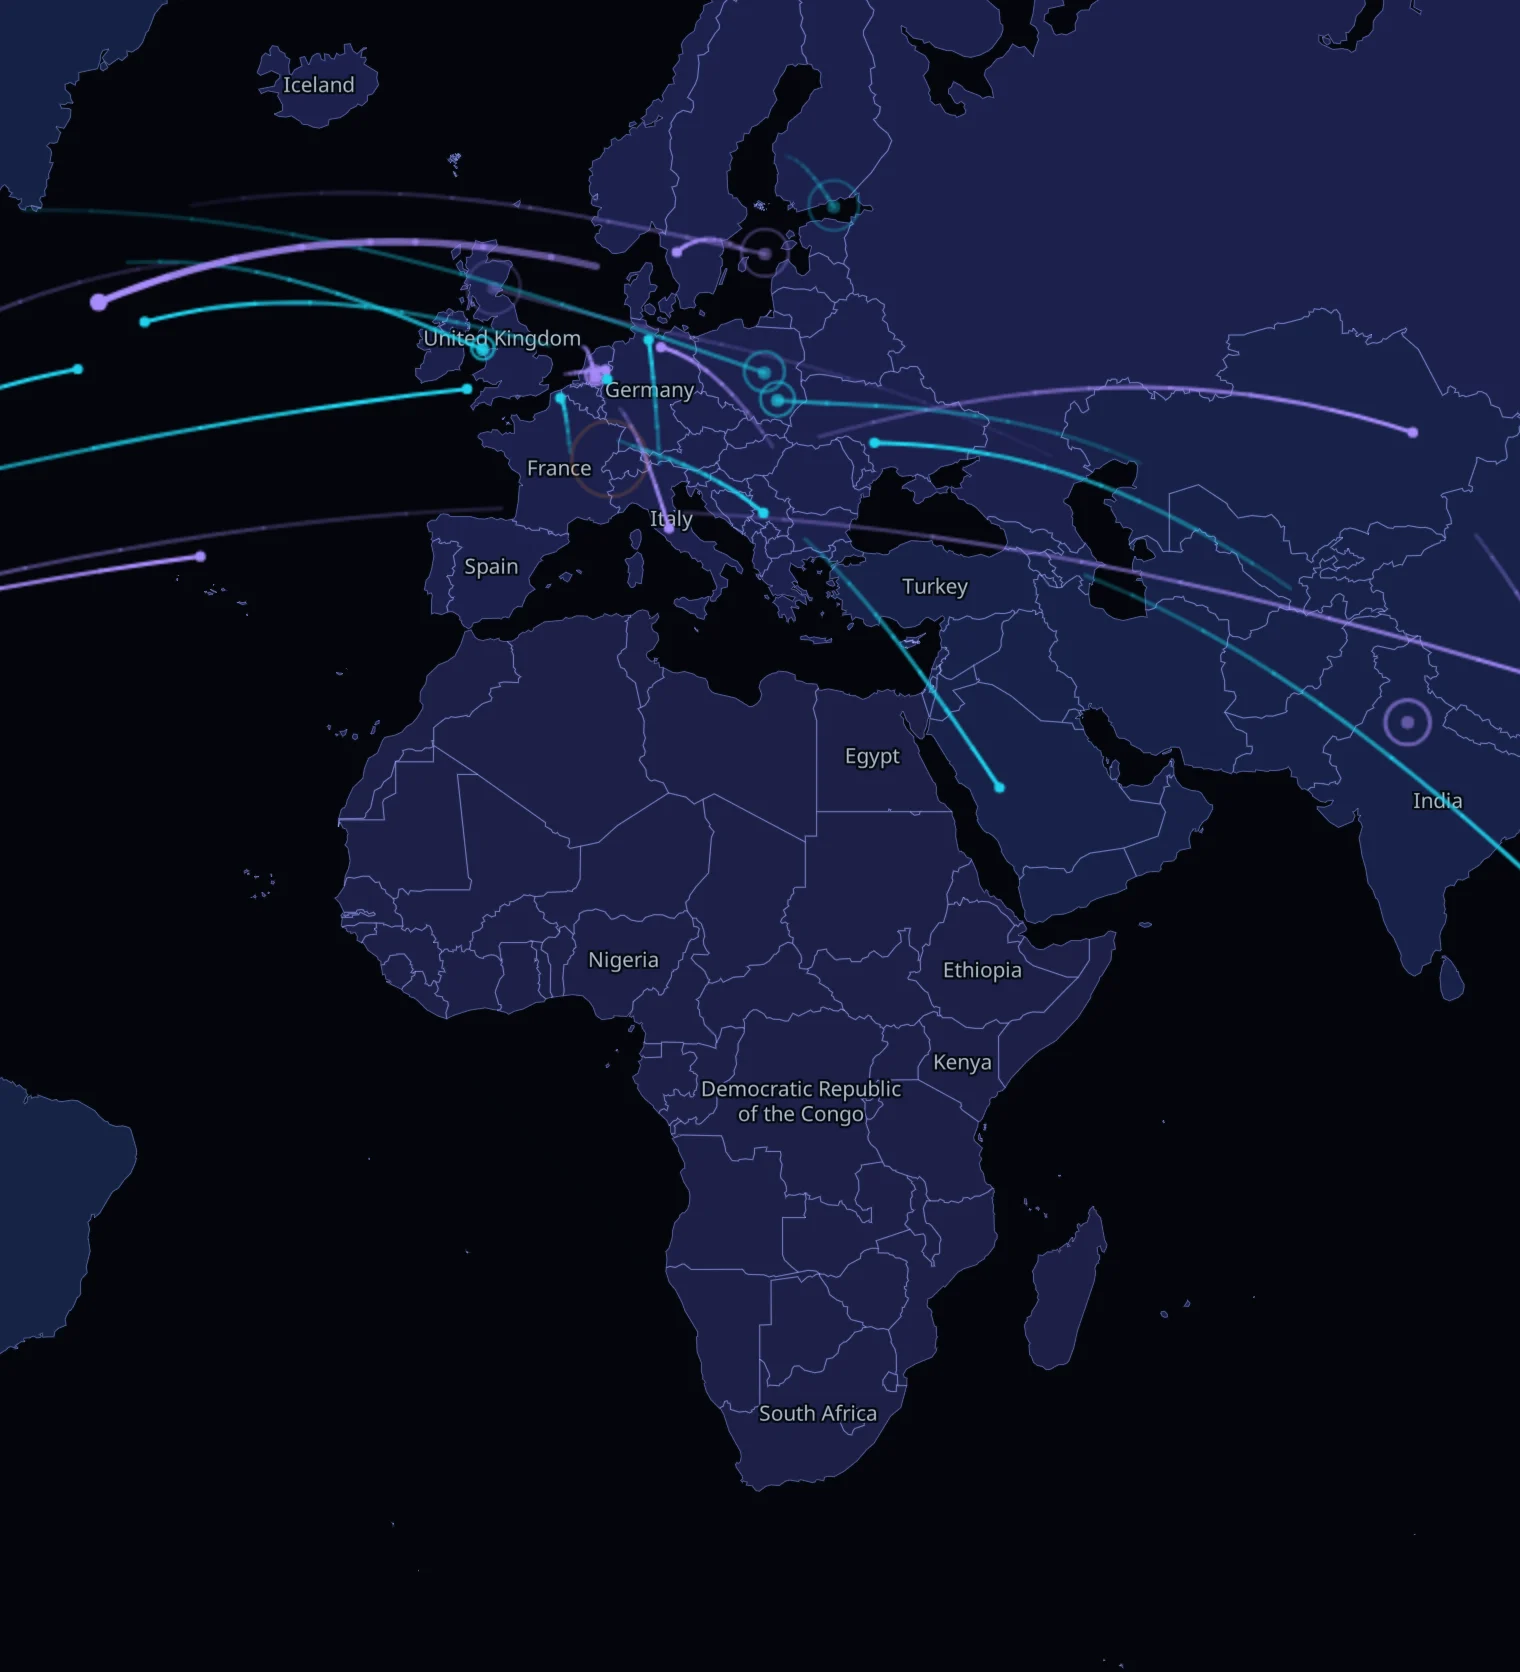
The 2D view shows the same arcs on a flat map.
On a phone the map comes first and the lists follow below it, so it works on a small screen too.
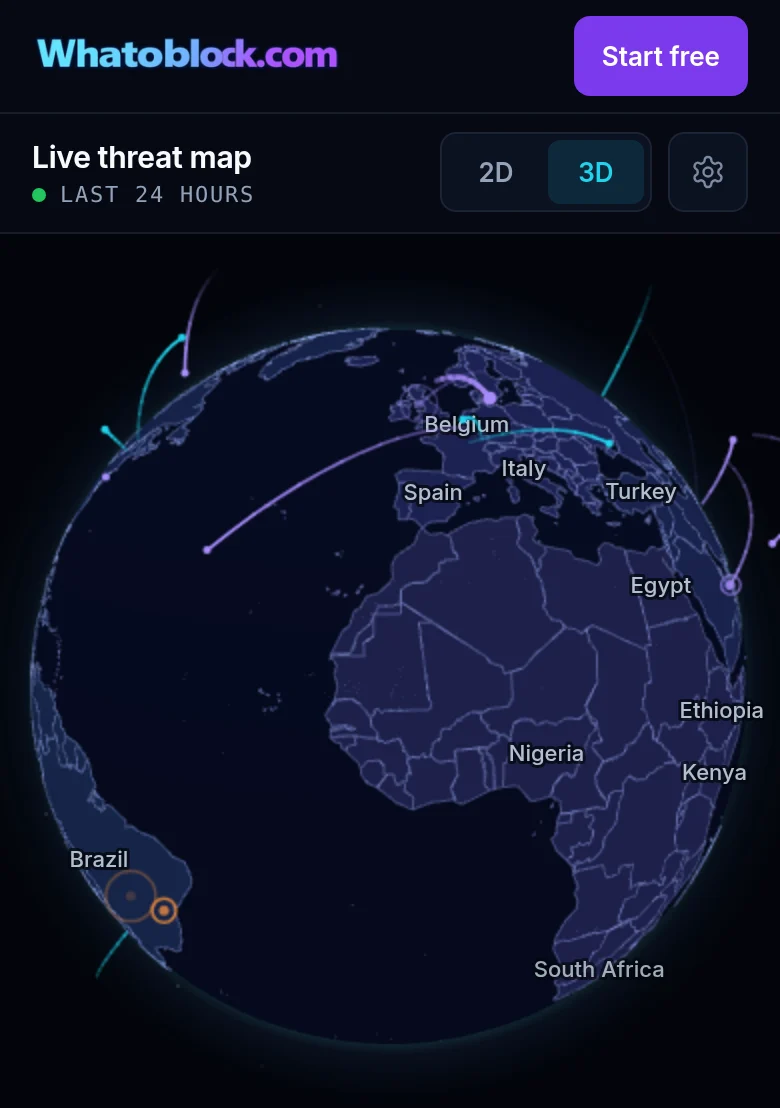
The map on a phone.
One day on the map, in numbers
That day the map held 65.070.107 events from 225 countries and territories:
| Layer | Events | Unique sources |
|---|---|---|
| Scanner | 64.817.633 | 110.467 |
| Botnet | 69.089 | 1.375 bots |
| Heartbeat | 183.385 | 181.216 |
Scanners make up nearly all of it, 64.817.633 of the 65.070.107 events. Botnet arcs are rarer but matter more, because each one is an attempt to take over a device.
A few addresses do most of the work
The violet arcs look evenly spread, but they are not. The busiest 1% of scanning addresses (1.105 of 110.467) sent 57.456.713 of the 64.817.633 scanner events (89%). The median scanning address sent 4 events. The 10 busiest addresses alone sent 7.507.514.
Scanning never stops
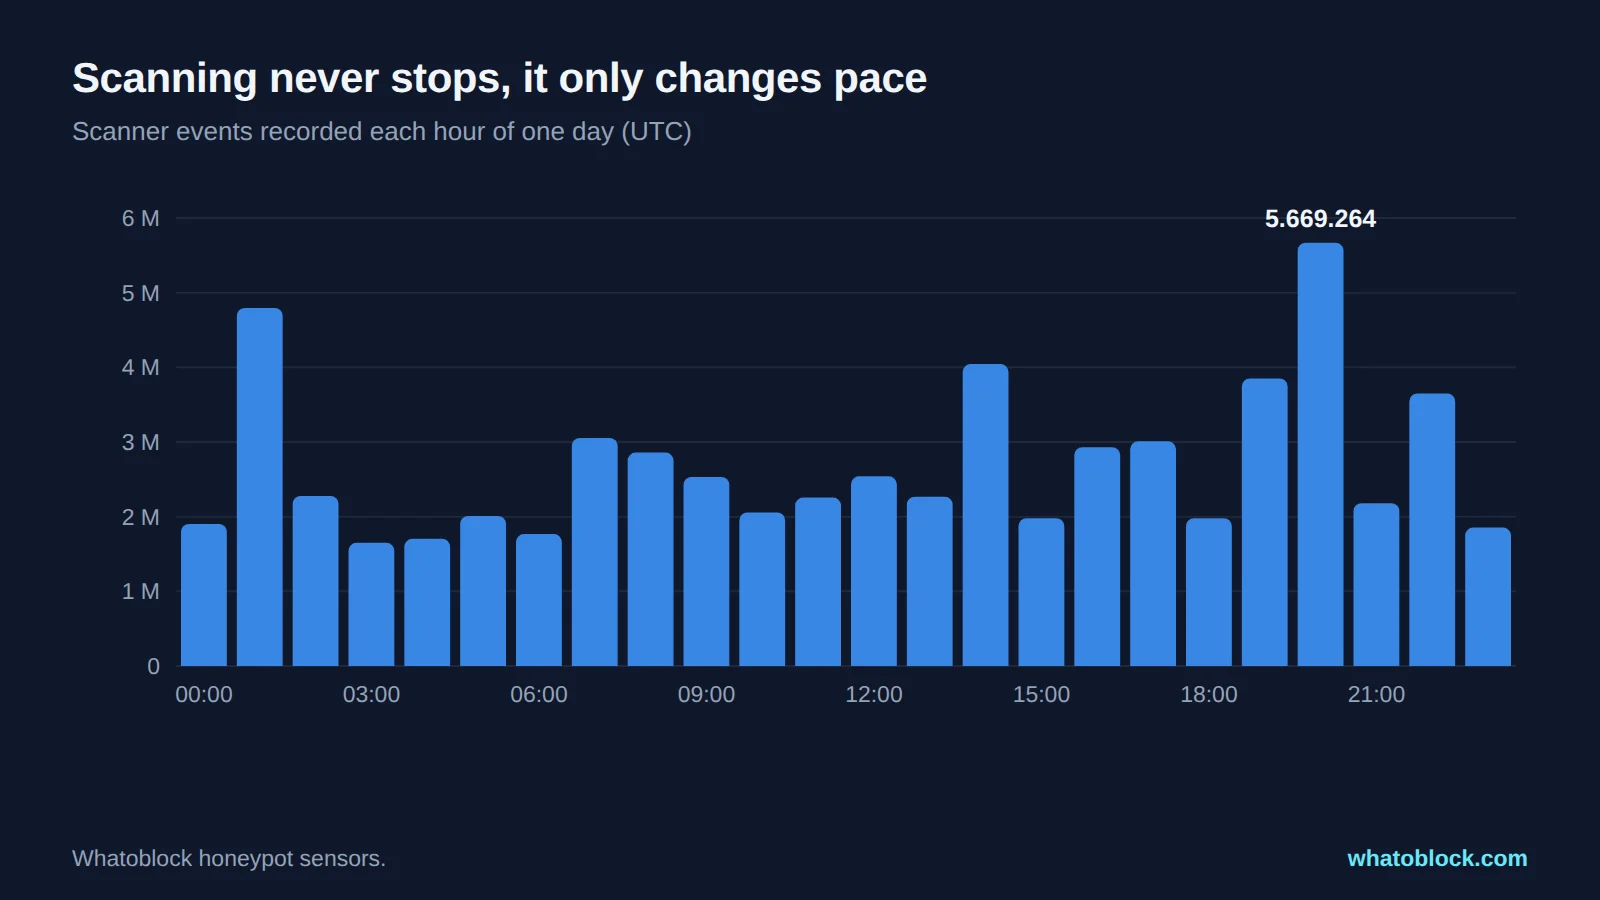
Scanner events recorded each hour of the day.
Every hour of the day brought between 1.650.019 scanner events (03:00 UTC) and 5.669.264 (20:00 UTC), from 14.271 to 22.094 different addresses an hour. There is no quiet night on the internet: the pace changes, but the arcs never stop.
Where the attacks came from
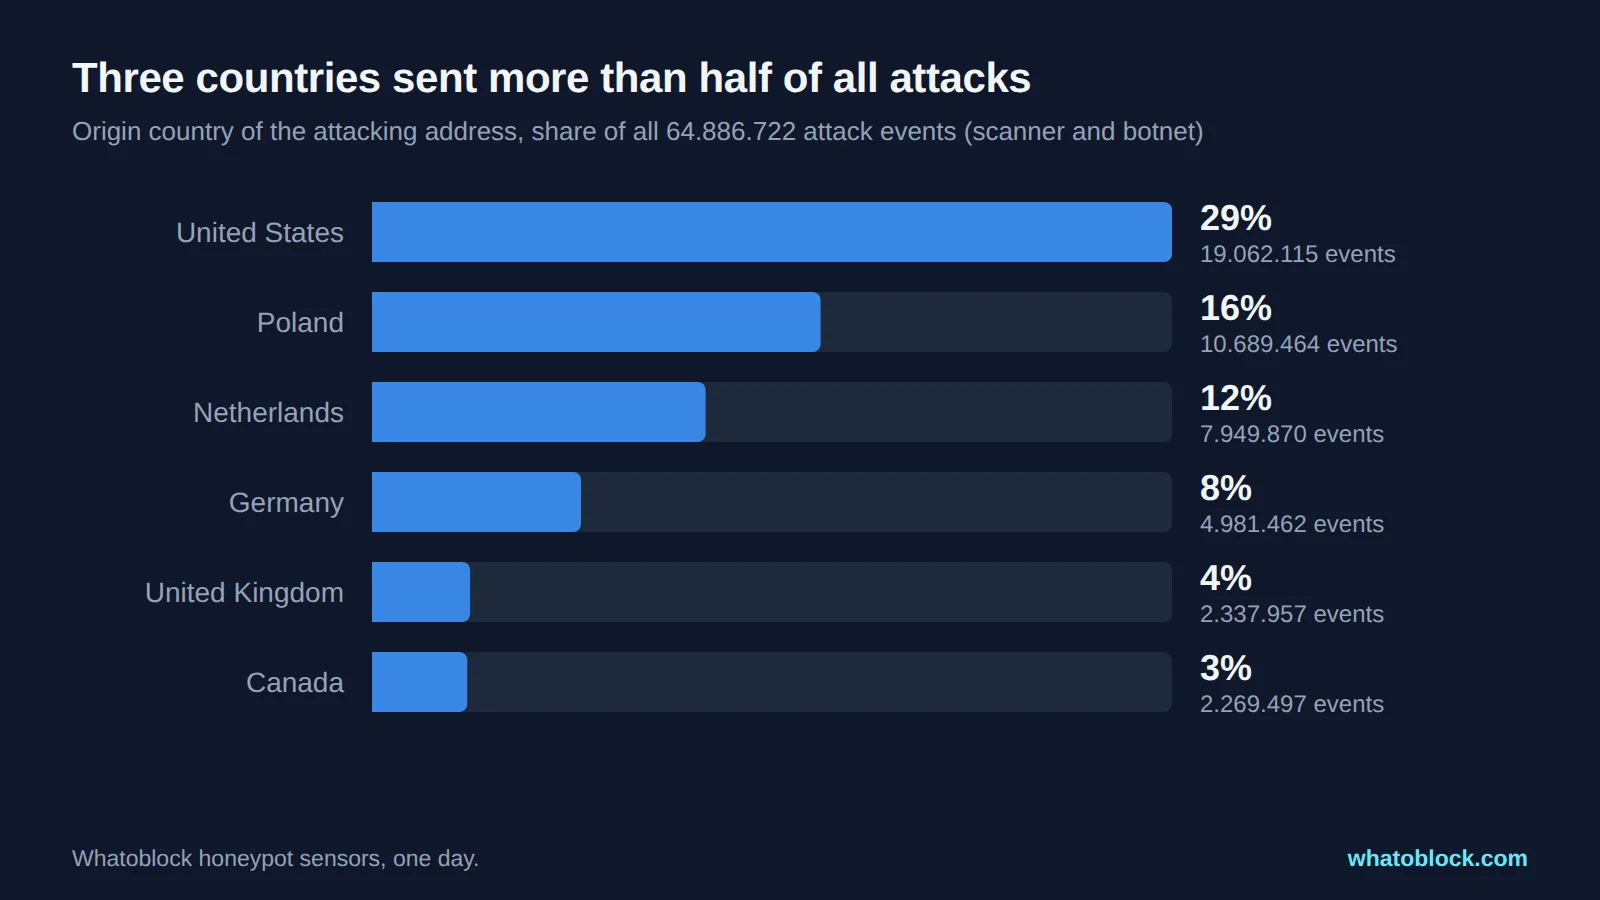
Origin countries by share of all scanner and botnet events.
Three countries sent more than half of all attacks: the United States, Poland and the Netherlands, 37.701.449 of 64.886.722 scanner and botnet events (58%). That says more about hosting than about nationality. Most scanning runs on rented servers, and a few hosting networks carry much of it:
| Network | Addresses | Scanner events |
|---|---|---|
| MEVSPACE, Poland | 100 | 12.462.963 |
| DigitalOcean, United States | 3.757 | 6.605.847 |
| Hetzner, Germany | 153 | 3.654.091 |
| Netrouting, Netherlands | 8 | 3.366.034 |
| HostPapa, United States | 194 | 2.628.308 |
The table shows where the attacking addresses were hosted, not who is behind them. Hosting providers serve many legitimate customers alongside rented or compromised servers.
What the attackers looked for
Counted by addresses, the most probed services were web servers (22.449 addresses), SSH (15.830), Ethereum nodes (14.118), Elasticsearch (9.458), Telnet (9.109) and Windows file sharing, SMB (8.456).
Counted by volume, remote desktops lead. VNC received 18.059.093 events from only 3.861 addresses, 28% of all scanner events, and RDP 13.395.235. Thousands of attempts from one address are the signature of automated password guessing.
Following one botnet arc
A cyan arc starts at an infected device, often a home router or a camera, and ends at the device it tries to infect next. The attack usually tells the target to download malware from a server the botnet uses, often its command and control (C2) server, the machine that controls the botnet.
That day, 1.375 bots drew botnet arcs. Among the attacks that named a C2 server by IP address, 664 different servers were used, and 148 of them served other bots rather than only the device itself. The busiest one, on UNMANAGED LTD in the Netherlands, was used by 70 bots that day. The live C2 server list ranks the most active servers, and our article on where to subscribe to a C2 and botnet feed shows how to block them.
Why the map runs about 10 minutes behind
The map is close to live, not instant. Its data is rebuilt every 10 minutes, your browser loads it again every 2 minutes, and Live activity replays the events in time order about 10 minutes behind real time. Heartbeat updates arrive in batches, so its pulses appear in short bursts.
For watching the threat landscape, 10 minutes is live enough. For protecting a network, the speed that matters is how fast an address reaches your firewall.
From the map to your firewall
The addresses behind these arcs feed the Whatoblock blocklists. They are rebuilt every hour and load into FortiGate, Palo Alto, pfSense and other firewalls as a plain list, with presets for each. Every paid plan includes scanner, botnet C2, proxy, Tor and DDoS sources, and a free sample feed lets you test the format first. See the blocklist plans and the integration guides.
Frequently asked questions
Can I see attacks on my own network on the map?
No. The map shows attacks on Whatoblock honeypot sensors. To see whether an address that reached your network is known, look it up in the Whatoblock dashboard, where a free account shows the latest records.
Can I show the map on a screen in our SOC?
Yes. It runs in any modern browser, and on a desktop screen the globe, the legend and the lists fit on one screen. Choose 2D or 3D and leave it open, it keeps updating.
Why do countries like the Netherlands rank so high?
Because of hosting. Large data centres sit there, and attackers rent servers wherever they are cheap and fast. A high rank shows where attack traffic is hosted, not where the attackers live.
About this data
- Day: 6 November 2026, 00:00 to 24:00 UTC.
- Events: counted exactly as the map counts them: one recorded connection or request for the Scanner and Botnet layers, one Heartbeat listing of a proxy, Tor exit node or DDoS source for the Heartbeat layer.
- Countries: the origin countries count scanner and botnet events only, because Heartbeat listings are not attacks.
- Botnet servers: C2 servers identified by IP address. C2 servers known only by domain name are not counted.
- Heartbeat: daily Heartbeat totals change with collection, so only the day's total is used.
- Screenshots: taken from the live map on 7 November 2026, so the legend shows that day's rolling 24 hours.
Check the live data
Open Scanner Recon with the last 24 hours selected.