
Every month our honeypot sensors record the scanning, brute force attempts and malware deliveries that hit any server exposed to the internet. This report covers 1 to 31 October 2026. It looks at who attacked, what they went after, the botnets and command and control (C2) servers behind the malware, and the proxy and DDoS networks tracked by Whatoblock Heartbeat. At the end, it puts the month in the context of the wider news: new exploited vulnerabilities, takedowns and DDoS reports.

October in numbers
- 909.438 attacking IP addresses from 222 countries and 18.903 networks sent 2.403.067.691 attack events to our sensors. Compared with the first 30 days of September, the number of attacking addresses fell 5% and the number of events rose 9%.
- 1% of attackers did 95% of the work. The 9.095 busiest addresses sent 2.290.873.465 of those events. The median attacker sent 2.
- 682.391 of the month's 909.438 attacking addresses (75%) were new, not seen at all in August or September.
- Nearly half of all events (46%) went to VNC, the remote desktop protocol, from just 25.432 addresses.
- An Android worm hit port 5555 from 40.186 addresses on 10 October alone, then vanished two days later.
- 11.236 C2 servers delivered malware to our sensors. In the first 30 days of the month that was 10.941, up from 9.860 in the first 30 days of September. 9.335 of them were infected devices serving the malware themselves.
- 4.034.270 residential proxy addresses, 10.777 DDoS sources and 1.532 Tor exits were tracked by Whatoblock Heartbeat.
Who attacked
Most attacking addresses came from large countries and large networks, as every month:
| Country | Addresses | Events |
|---|---|---|
| United States | 204.221 | 748.629.622 |
| China | 106.390 | 76.091.478 |
| India | 61.775 | 49.674.213 |
| Ireland | 40.692 | 1.937.130 |
| Pakistan | 40.208 | 4.672.916 |
| Russia | 32.270 | 29.576.531 |
| United Kingdom | 31.069 | 122.054.200 |
| Germany | 25.948 | 282.756.841 |
By network, cloud and hosting providers led on addresses: DigitalOcean with 79.157, Amazon (AS16509) with 46.083, followed by China Unicom (41.987), Chinanet (33.454), Pakistan Telecommunication (23.622) and 3xK Tech (23.117).
Volume tells a different story. A handful of hosting networks sent far more events per address than anyone else:
| Network | Addresses | Events |
|---|---|---|
| MEVSPACE (AS201814) | 262 | 267.611.688 |
| DigitalOcean (AS14061) | 79.157 | 226.812.314 |
| Contabo (AS51167) | 1.705 | 167.126.864 |
| HostPapa (AS36352) | 1.102 | 127.815.418 |
| OVH (AS16276) | 1.934 | 51.643.262 |
| Hetzner (AS24940) | 1.121 | 51.604.203 |
A ranking like this shows where attack traffic came from, not who is responsible for it. Hosting providers serve many legitimate customers alongside rented or compromised servers. Our live rankings are updated daily.
Ireland stands out in the country list with 40.692 addresses but only 1.937.130 events. From 4 October, 39.973 of Ireland's 40.623 addresses were on Amazon's network (AS16509), sending 258.817 events between them, about 6 each: many cloud addresses, each used briefly.
The concentration is the same story we see every month. The 9.095 busiest addresses (1%) sent 95% of the 2.403.067.691 events, while the median address sent 2. A small, frequently refreshed blocklist removes most of the noise, but catching the long tail of quiet attackers takes a much larger one. Our FortiGate threat feed guide measures that trade off.
What they went after
Counted by attackers, the most targeted services were web servers (148.097 addresses), botnet infection attempts against IoT devices (137.409), SSH (132.437), Telnet (110.592), open proxy checks (103.854) and Windows file sharing, SMB (89.855).
Counted by volume, the picture flips:
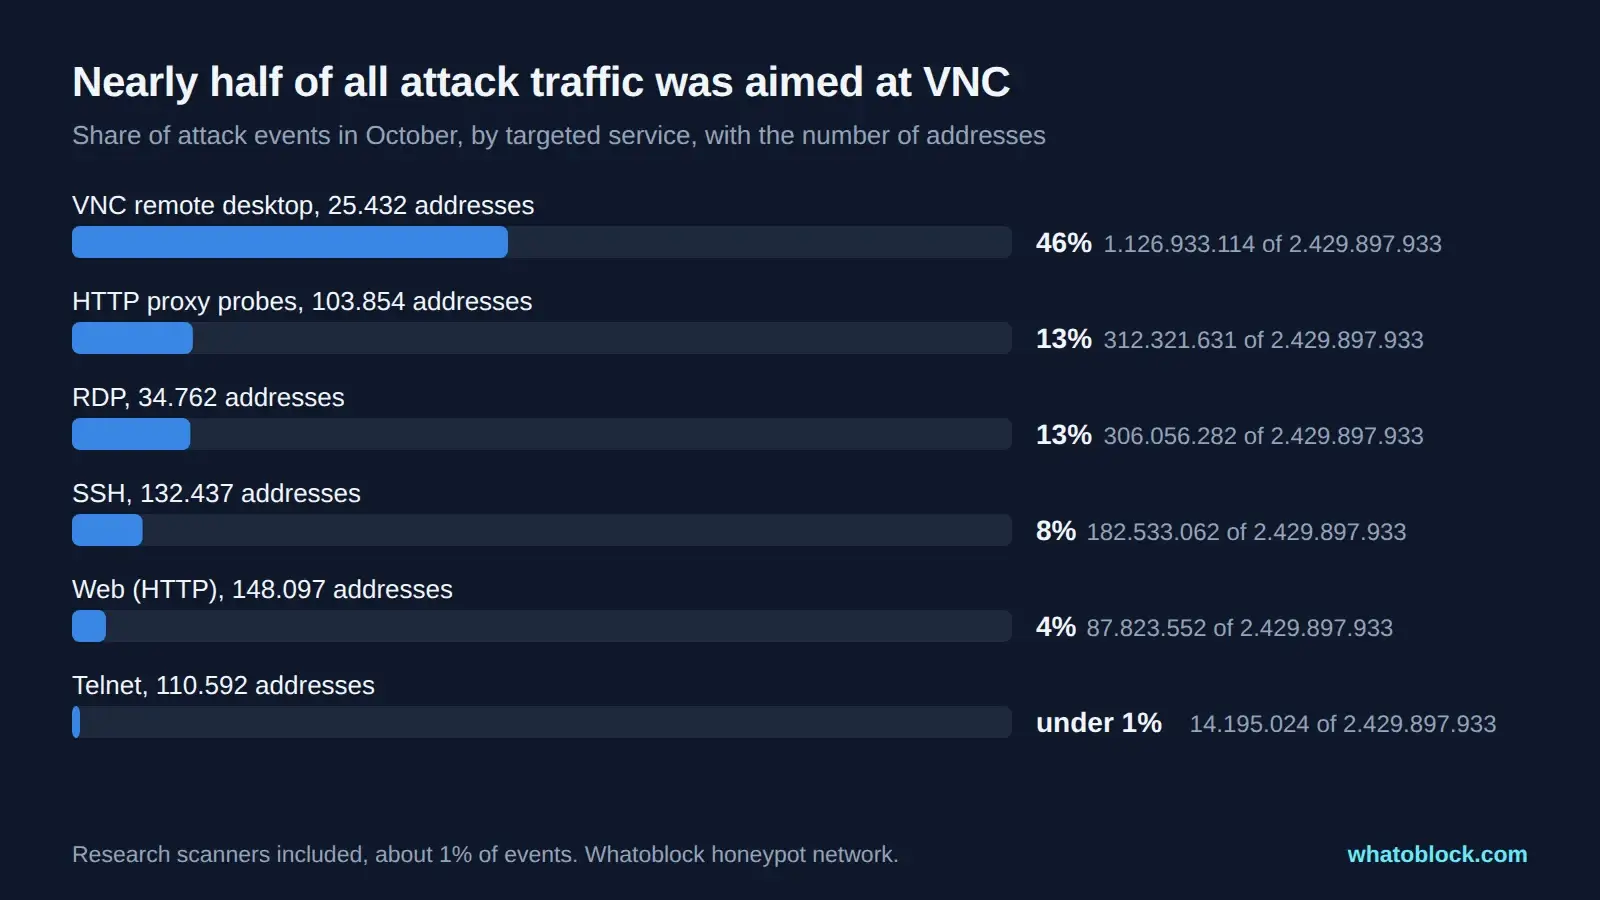
Share of attack events in October, by targeted service.
VNC received 1.126.933.114 events from only 25.432 addresses, an average of about 44.000 each. A few addresses sending tens of thousands of connections each is the typical pattern of automated password guessing, and most of the volume came from a few hosting networks. From 4 October: DigitalOcean (181.329.984 events from 3.536 addresses), Contabo (119.281.525 from 94) and HostPapa (102.200.530 from 84). RDP followed the same pattern with 306.056.282 events from 34.762 addresses. If you expose VNC or RDP to the internet, expect heavy automated login attempts from single addresses.
An Android worm wave
The most visible event of the month lasted three days. From 9 to 11 October, tens of thousands of addresses sent Android Debug Bridge (ADB) commands to port 5555:
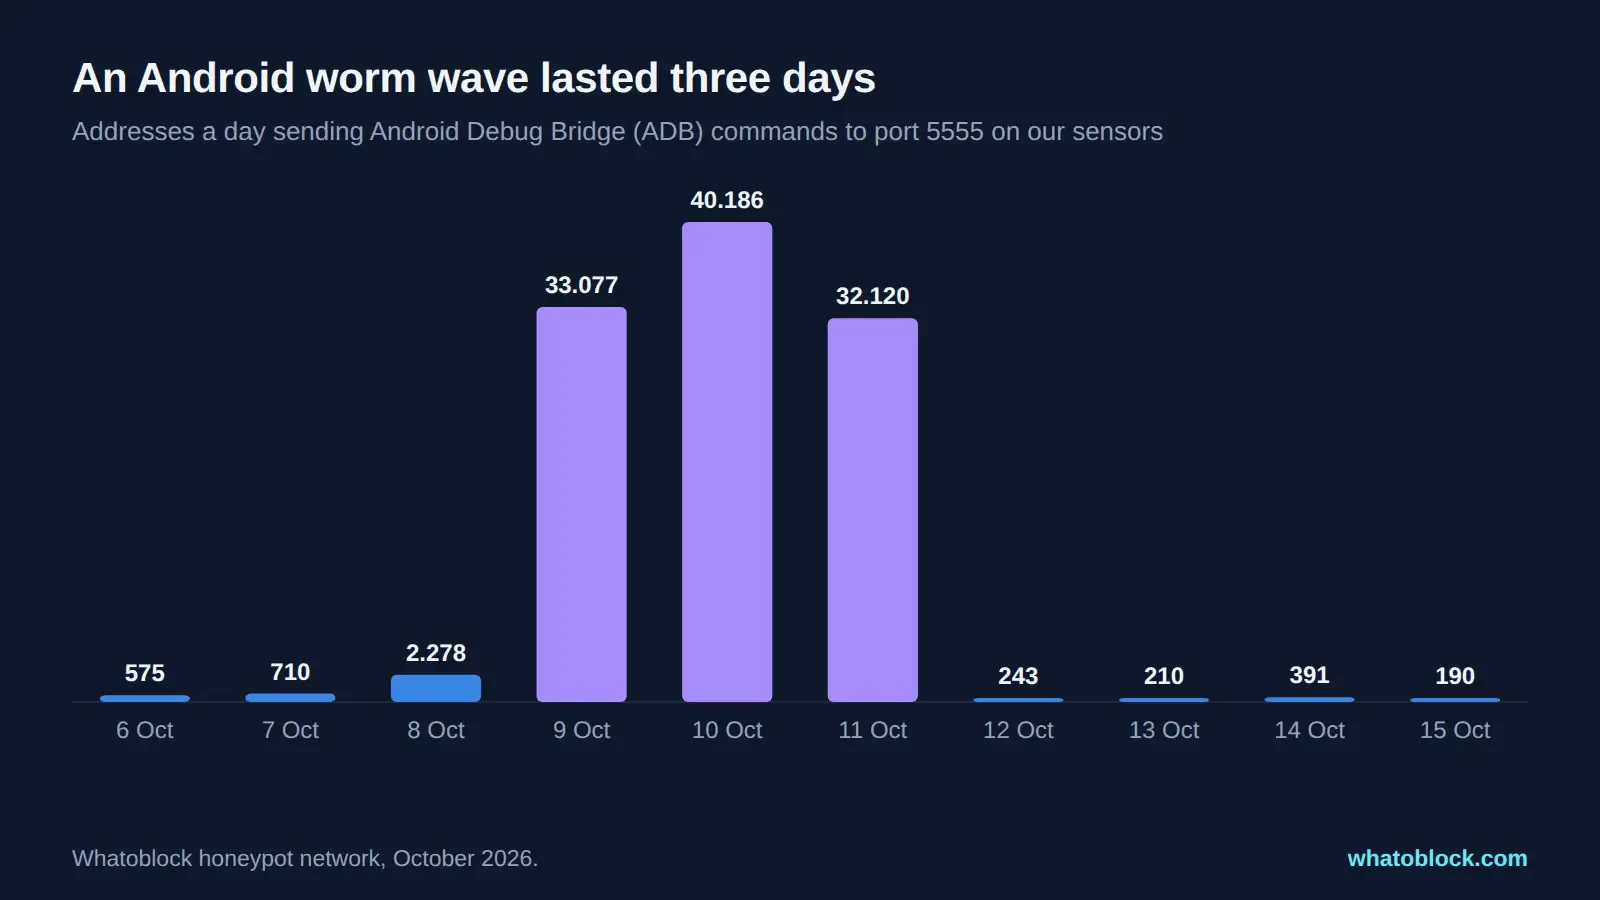
Addresses a day sending Android Debug Bridge commands to port 5555.
ADB is a debugging interface for Android. It should never be reachable from the internet, but many cheap Android TV boxes and set top boxes ship with it open. The command each device sent was the same:
- Change to a writable folder such as
/data/local/tmp. - Download an app called
Services.apkfrom 217.60.195.187, trying curl, toybox, wget and busybox in turn. - Install it with
pm installand enable it under a name made to look like a Google system service,com.google.android.system.service.
The sources were spread evenly across the world, with Indonesia (1.046), Bangladesh (984), Russia (979), Turkey (968), India (905) and Brazil (887) leading on 10 October. That is what a worm looks like: each infected box scans for the next one. The download server sits on SWISSNET LLC (AS209373) in the Netherlands, a network that also hosted one of the most active C2 servers in our Tor exit node analysis.
On 12 October the traffic dropped to 243 addresses. We cannot tell from our side whether the server went offline, the operator stopped, or the botnet moved on.
If you run Android devices: make sure port 5555 is never reachable from outside your network, and check TV boxes and set top boxes for apps you did not install.
Other spikes
- ScreenConnect on 27 October. 11.664 addresses probed ConnectWise ScreenConnect, the remote support tool, against about 1.283 on a typical October day. ScreenConnect was probed by 41.083 addresses over the month.
- AI agent servers. Requests to
/mcp, the usual path of a Model Context Protocol server, came from between 3.442 and 3.825 addresses in each full week of October. MCP servers connect AI agents to tools and data, so an exposed one can give an attacker the same access. The steady weekly numbers suggest routine scanning rather than a single campaign. - Web scanning on 22 October. About 11.600 more addresses than usual sent web requests, the day after the PHP2Shell vulnerabilities were disclosed. No single request type explains the jump, so we do not attribute it to PHP2Shell.
Botnets and C2 servers
In October, 11.236 C2 servers delivered malware to our sensors. In the first 30 days of the month that was 10.941, against 9.860 in the first 30 days of September. 30.779 infected devices were seen delivering malware, and 5.000 malware samples were new to us.
Most of these servers are not dedicated infrastructure. 9.335 of the 11.236 were infected devices serving the malware themselves, so the infection spreads from victim to victim. 2.033 were servers that other bots pointed to, and 132 addresses did both:
| Network | Dedicated C2 servers | Bots pointing to them |
|---|---|---|
| Verizon Business (AS701) | 257 | 51 |
| T-Mobile USA (AS21928) | 190 | 15 |
| Alibaba US (AS45102) | 152 | 252 |
| Microsoft (AS8075) | 141 | 120 |
| Metrofibre Networx (AS327782) | 94 | 108 |
| Storm Industries (AS219502) | 30 | 13.292 |
The last row stands out. 30 servers on Storm Industries were used by 13.292 bots, far more than any other network. By country, the dedicated servers were mostly in the United States (788), China (215), Pakistan (140), South Africa (103) and the Netherlands (98). The live C2 server list shows the most active ones.
Proxies, DDoS sources and Tor
These figures come from Whatoblock Heartbeat and are October totals only. The way this data is collected changed during the month, so we do not compare them with September.
| Category | Addresses in October |
|---|---|
| Residential proxies | 4.034.270 in 237 countries |
| Datacenter proxies | 191.139 |
| Open proxies | 48.470 |
| DDoS sources | 10.777 in 166 countries |
| Tor exit nodes | 1.532 |
Datacenter proxies were concentrated in the first days of the month: 159.204 of the 191.139 appeared between 1 and 3 October. From 4 October, DDoS sources came mostly from Indonesia (1.423), the Philippines (497), South Africa (437), the United States (436) and Mexico (302). Our guides on residential proxies and datacenter proxies explain how to detect and block them. The live rankings for DDoS sources, residential proxies and Tor exit nodes show the networks behind them.
October in context
- New exploited vulnerabilities. CISA added 36 vulnerabilities to its Known Exploited Vulnerabilities catalog in October, among them flaws in Fortinet FortiMail, Citrix NetScaler, Ivanti Connect Secure, Atlassian Data Center, BeyondTrust Remote Support, Plex Media Server, GitLab and the two PHP2Shell vulnerabilities in PHP.
- PHP2Shell. PHP released fixes for CVE-2026-109618 and CVE-2026-109619 on 21 October. Amazon reported a first attempt on its honeypots four days before disclosure, and GreyNoise had counted 444 attacking addresses by 30 October.
- Virtualine seized. On 27 October the FBI seized the domain of Virtualine, a bulletproof hosting provider also known as Omegatech. We covered what its network sent to our sensors in our Virtualine analysis.
- Scanning tools seized. On 8 October the US Justice Department seized domains of Microscan, a vulnerability scanning tool that used a Mirai based IoT botnet, and FishHub, both linked to a Chinese company.
- DDoS. Cloudflare's report for the third quarter, published on 29 October, counted more than 18 million network layer attacks and said Mirai traffic made up nearly half of the attack bytes.
What to do with this
- Close VNC, RDP and ADB to the internet. They drew the most traffic per attacker this month. Put them behind a VPN.
- Block the busiest attackers. 1% of addresses sent 95% of the events. A blocklist refreshed every hour removes most of that traffic.
- Watch outbound traffic to C2 servers. Infected devices call home, and a firewall rule against known C2 addresses both blocks the malware and tells you which device is infected.
Methodology
- Period: 1 to 31 October 2026, UTC. Month on month comparisons use the first 30 days of September and October. A few details that combine two breakdowns, the VNC networks, the Ireland split and the DDoS countries, cover 4 to 31 October.
- Attackers and events: every address that sent traffic to our honeypot sensors, with known research scanners such as Censys and Shadowserver excluded. An event is one recorded connection or request. The country, network and service figures include research scanners, 13.438 addresses that sent about 1% of all events.
- New attackers: addresses seen in October and not at any time from 1 August to 30 September 2026.
- C2 servers: IP addresses our sensors saw delivering malware. Servers known only by domain name are not counted, because domain tracking started recently.
- Proxies, DDoS sources and Tor: addresses tracked by Whatoblock Heartbeat during October.
- Context: taken from CISA, the US Justice Department, PHP, Amazon, GreyNoise and Cloudflare, linked below.
Sources
- CISA Known Exploited Vulnerabilities catalog
- PHP security release, 21 October 2026 and CISA alert on PHP
- Amazon threat intelligence on PHP2Shell and GreyNoise PHP2Shell tracker
- US Justice Department, Virtualine domain seizure
- US Justice Department, Microscan and FishHub seizure
- Cloudflare DDoS threat report, 2026 Q3
Check the live data
Open Scanner Recon with the last 24 hours selected.